AdWords Geo Analysis by Period, Country with Heat Map
Easily Visualize Geo Performance with Excel Heat Maps
Now you can easily create and visualize AdWords Geo data by any period. View worldwide region, country and related metrics in a heat-map visualization to immediately understand and recognize trends.
The MarketFlare DNA software now comes with a new DNA report, “Analysis:AdWords Geo Regions.”
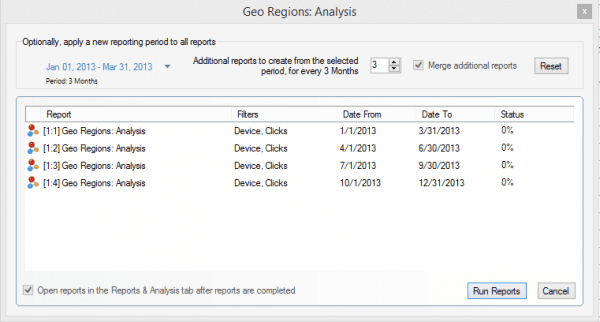
You could use the “Filters” tool to only include specific data. For example, only countries where the number of clicks is greater than 0.
Simply select any daily, weekly, or quarterly period and run the report.
Next simply opt to “Export Selected Data.”
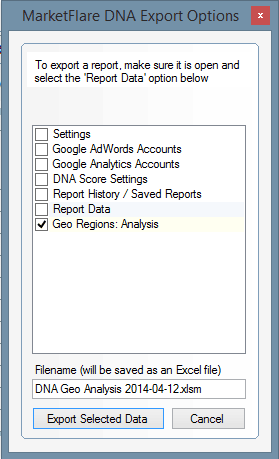
The geo analysis report will be selected for export after opting to “Export Geo Analysis”
AdWords geo data is exported into a macro-enabled Excel file and your data will automatically be color-conditioned, pivoted, and formatted. A worksheet is created for each major metric, optionally including any selected conversion metrics. For example, impression data by period in the EUNA region:
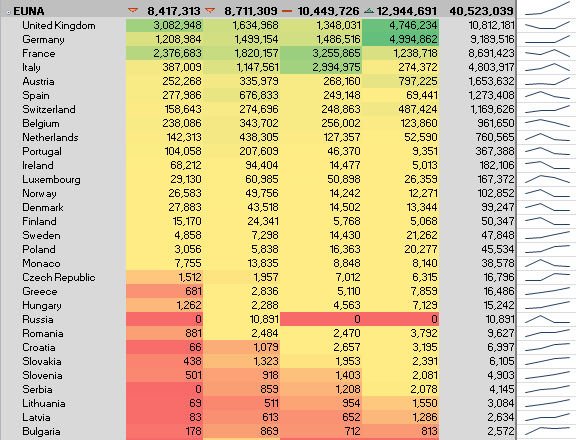
Example: EUNA region impressions data by country and quarter
The new ppc geo analysis report is useful for agencies, marketing pros, and financial departments to quickly obtain a clear view of worldwide performance metrics in order to make better decisions related to budgeting and forecasting. Try it out and let us know how it works for you.
More from our blog
See all posts


Recent Posts
- What are Google Google Ads Multi Attribution Reports? March 29, 2016
- Automated Google Ads Reports & More January 16, 2016
- Google Ads & Bing Ads to Excel Export January 14, 2016
Leave a Comment cancel
This site uses Akismet to reduce spam. Learn how your comment data is processed.