Beyond AdWords Charts: Instant Report Visualization
AdWords Reporting & Visualization For Power Users
Update: January 2015 – Now with Bing Ads visualization support!
MarketFlare DNA supports fast, bulk reporting jobs to easily create any AdWords reports and drill down into data. Another powerful feature is an AdWords visualization tool with the ability to immediately visualize the report with the following AdWords performance charts:
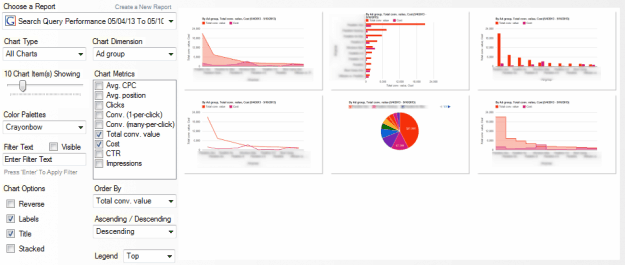
View all chart types for a report, and click through to fine-tune the visualization
- Area
- Bar
- Column
- Line
- Pie
- Stepped Area
- Timeline
- Geo
- Treemap
- Table
Simply click the “Visualize” button from any report view! Then just right-click on the visualization to save the chart to a PNG or JPG for easy cut-and-paste into your presentation.
Better Campaign Management with Report Visualization Software
Distinguished visualization features are not only useful for creating impressive client reports, they help to make better campaign management decisions:
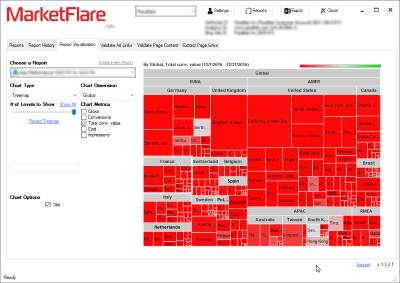
- AdWords Geo Performance reports can incorporate “DNA Custom Regions” such as AMER, EUNA, APAC, RMEA (predefined, or define your own!); and you can view this in a Treemap and drill down from your custom region, to country, to metro areas!
- If you have included Total conv. value and Cost metrics, then in the Line chart you can add ROAS labels; or, view ROAS in any chart if you opted to include this custom metric when creating the report.
- The “Filter Text” feature is very powerful, especially for Search Query Performance reports. This enables you to immediately see how search queries with certain words are performing. Find negative keywords. Or in a Campaign Performance report, quickly visualize campaigns by text – useful if you name your campaigns with region, search/content, product, business unit, or other identifiers.
- Fine tune the visualization to show a specific number of items, sort order, legend placement, and more!
- Data is easily exported to Excel to enable additional custom graphs and charts.
Download the free MarketFlare DNA PPC reporting tool and see what you’ve been missing!
More from our blog
See all posts


Recent Posts
- What are Google Google Ads Multi Attribution Reports? March 29, 2016
- Automated Google Ads Reports & More January 16, 2016
- Google Ads & Bing Ads to Excel Export January 14, 2016
Leave a Comment cancel
This site uses Akismet to reduce spam. Learn how your comment data is processed.